Tumor Immune Syngeneic MOuse (TISMO) is a database specifically designed for hosting, visualizing, and analyzing an extensive collection of syngeneic mouse model data. We uniformly processed raw sequencing data for 1,518 mouse samples, covering 68 cell lines and 19 cancer types, to generate gene expression and immune cell infiltration profiles, of which 832 were from immune checkpoint blockade (ICB) studies. In addition, TISMO hosts 605 in vitro samples of which 195 were cytokine treated. Sample metadata, including cancer type, cell line, mouse strain, transplantation site, ICB treatment, and response status were manually curated. TISMO provides interactive interfaces for users to explore gene expression and immune infiltration, and allows systematic comparisons between different model characteristics, and treatment and response groups.
Get started by exploring: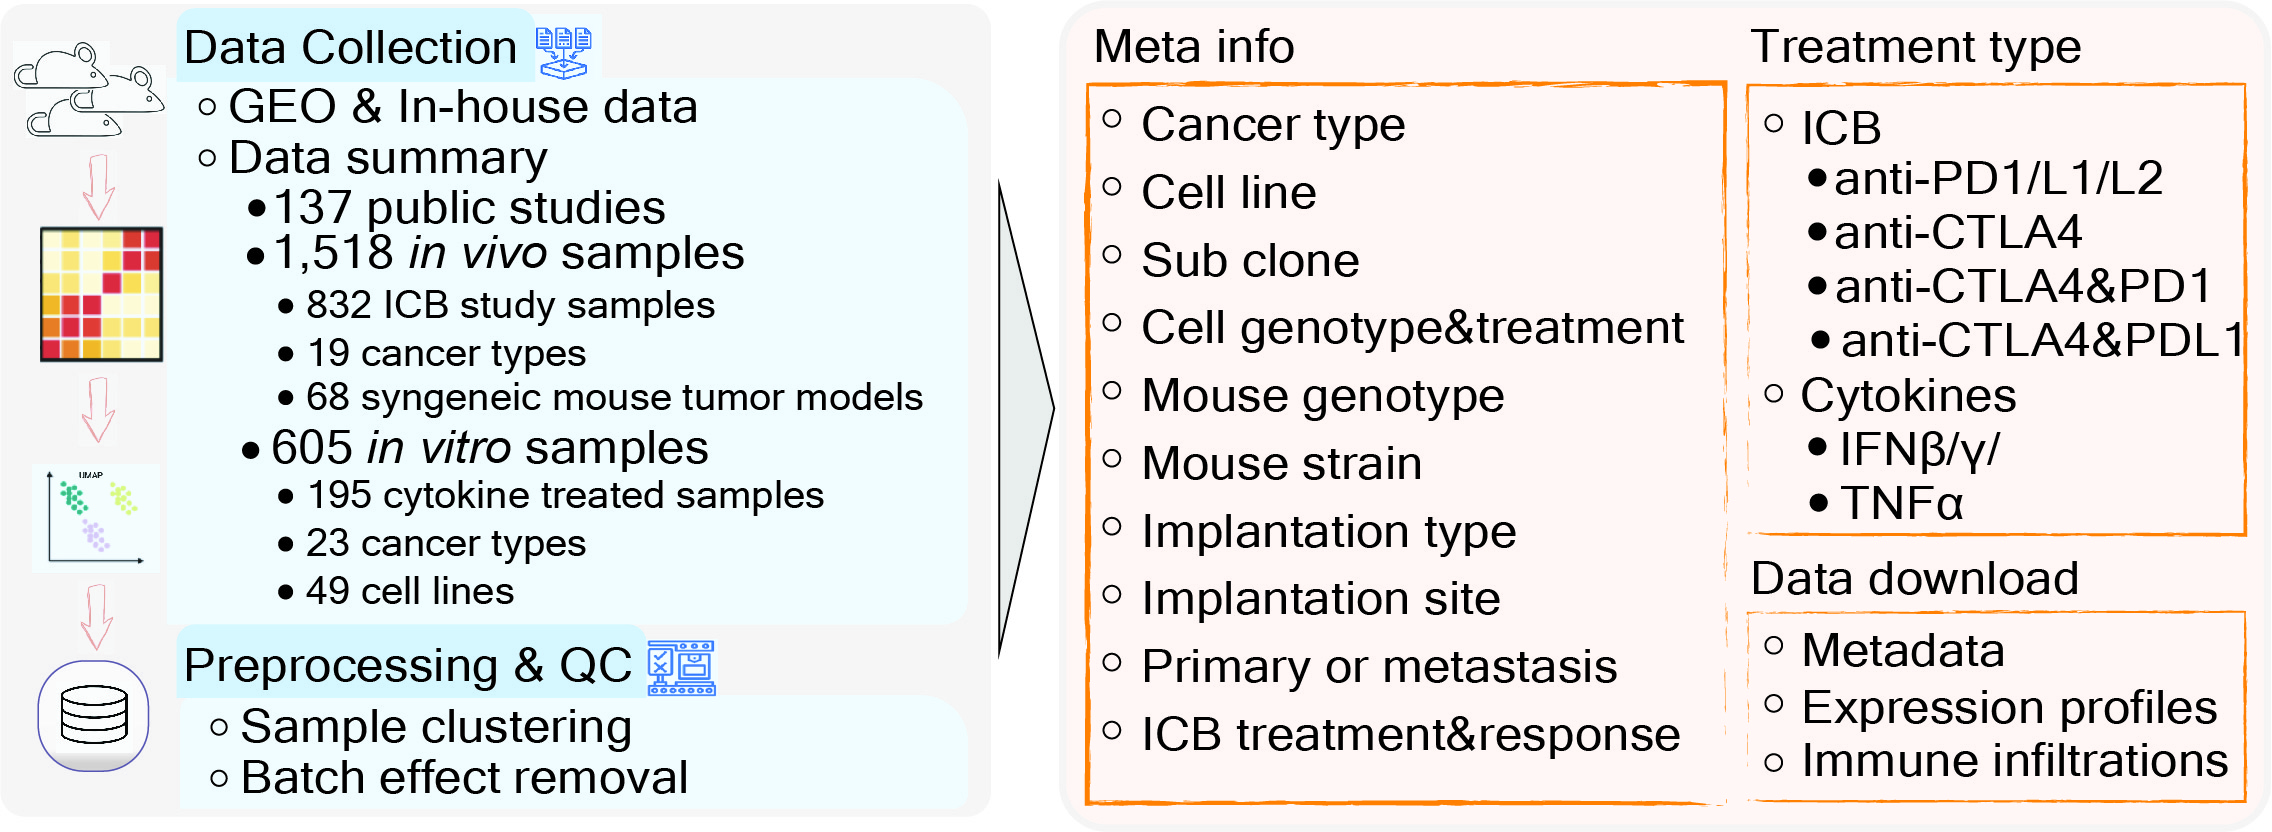
Tutorial:
Cite us!
Zexian Zeng*#, Cheryl J Wong*, Lin Yang*, Nofal Ouardaoui, Dian Li, Wubing Zhang, Shengqing Gu, Yi Zhang, Yang Liu, Xiaoqing Wang, Jingxin Fu, Liye Zhou, Boning Zhang, Sarah Kim, Kathleen B Yates, Myles Brown, Gordon J Freeman, Ravindra Uppaluri, Robert Manguso, X Shirley Liu#. TISMO: syngeneic mouse tumor database to model tumor immunity and immunotherapy response. Nucleic Acids Research 2021 [DOI] [PubMed]
Zexian Zeng:
zzeng@ds.dfci.harvard.edu
X Shirley Liu:
xsliu@ds.dfci.harvard.edu
User Visiting Statistics
TISMO | © X Shirley Liu Lab 2021 | Dana Farber Cancer Institute
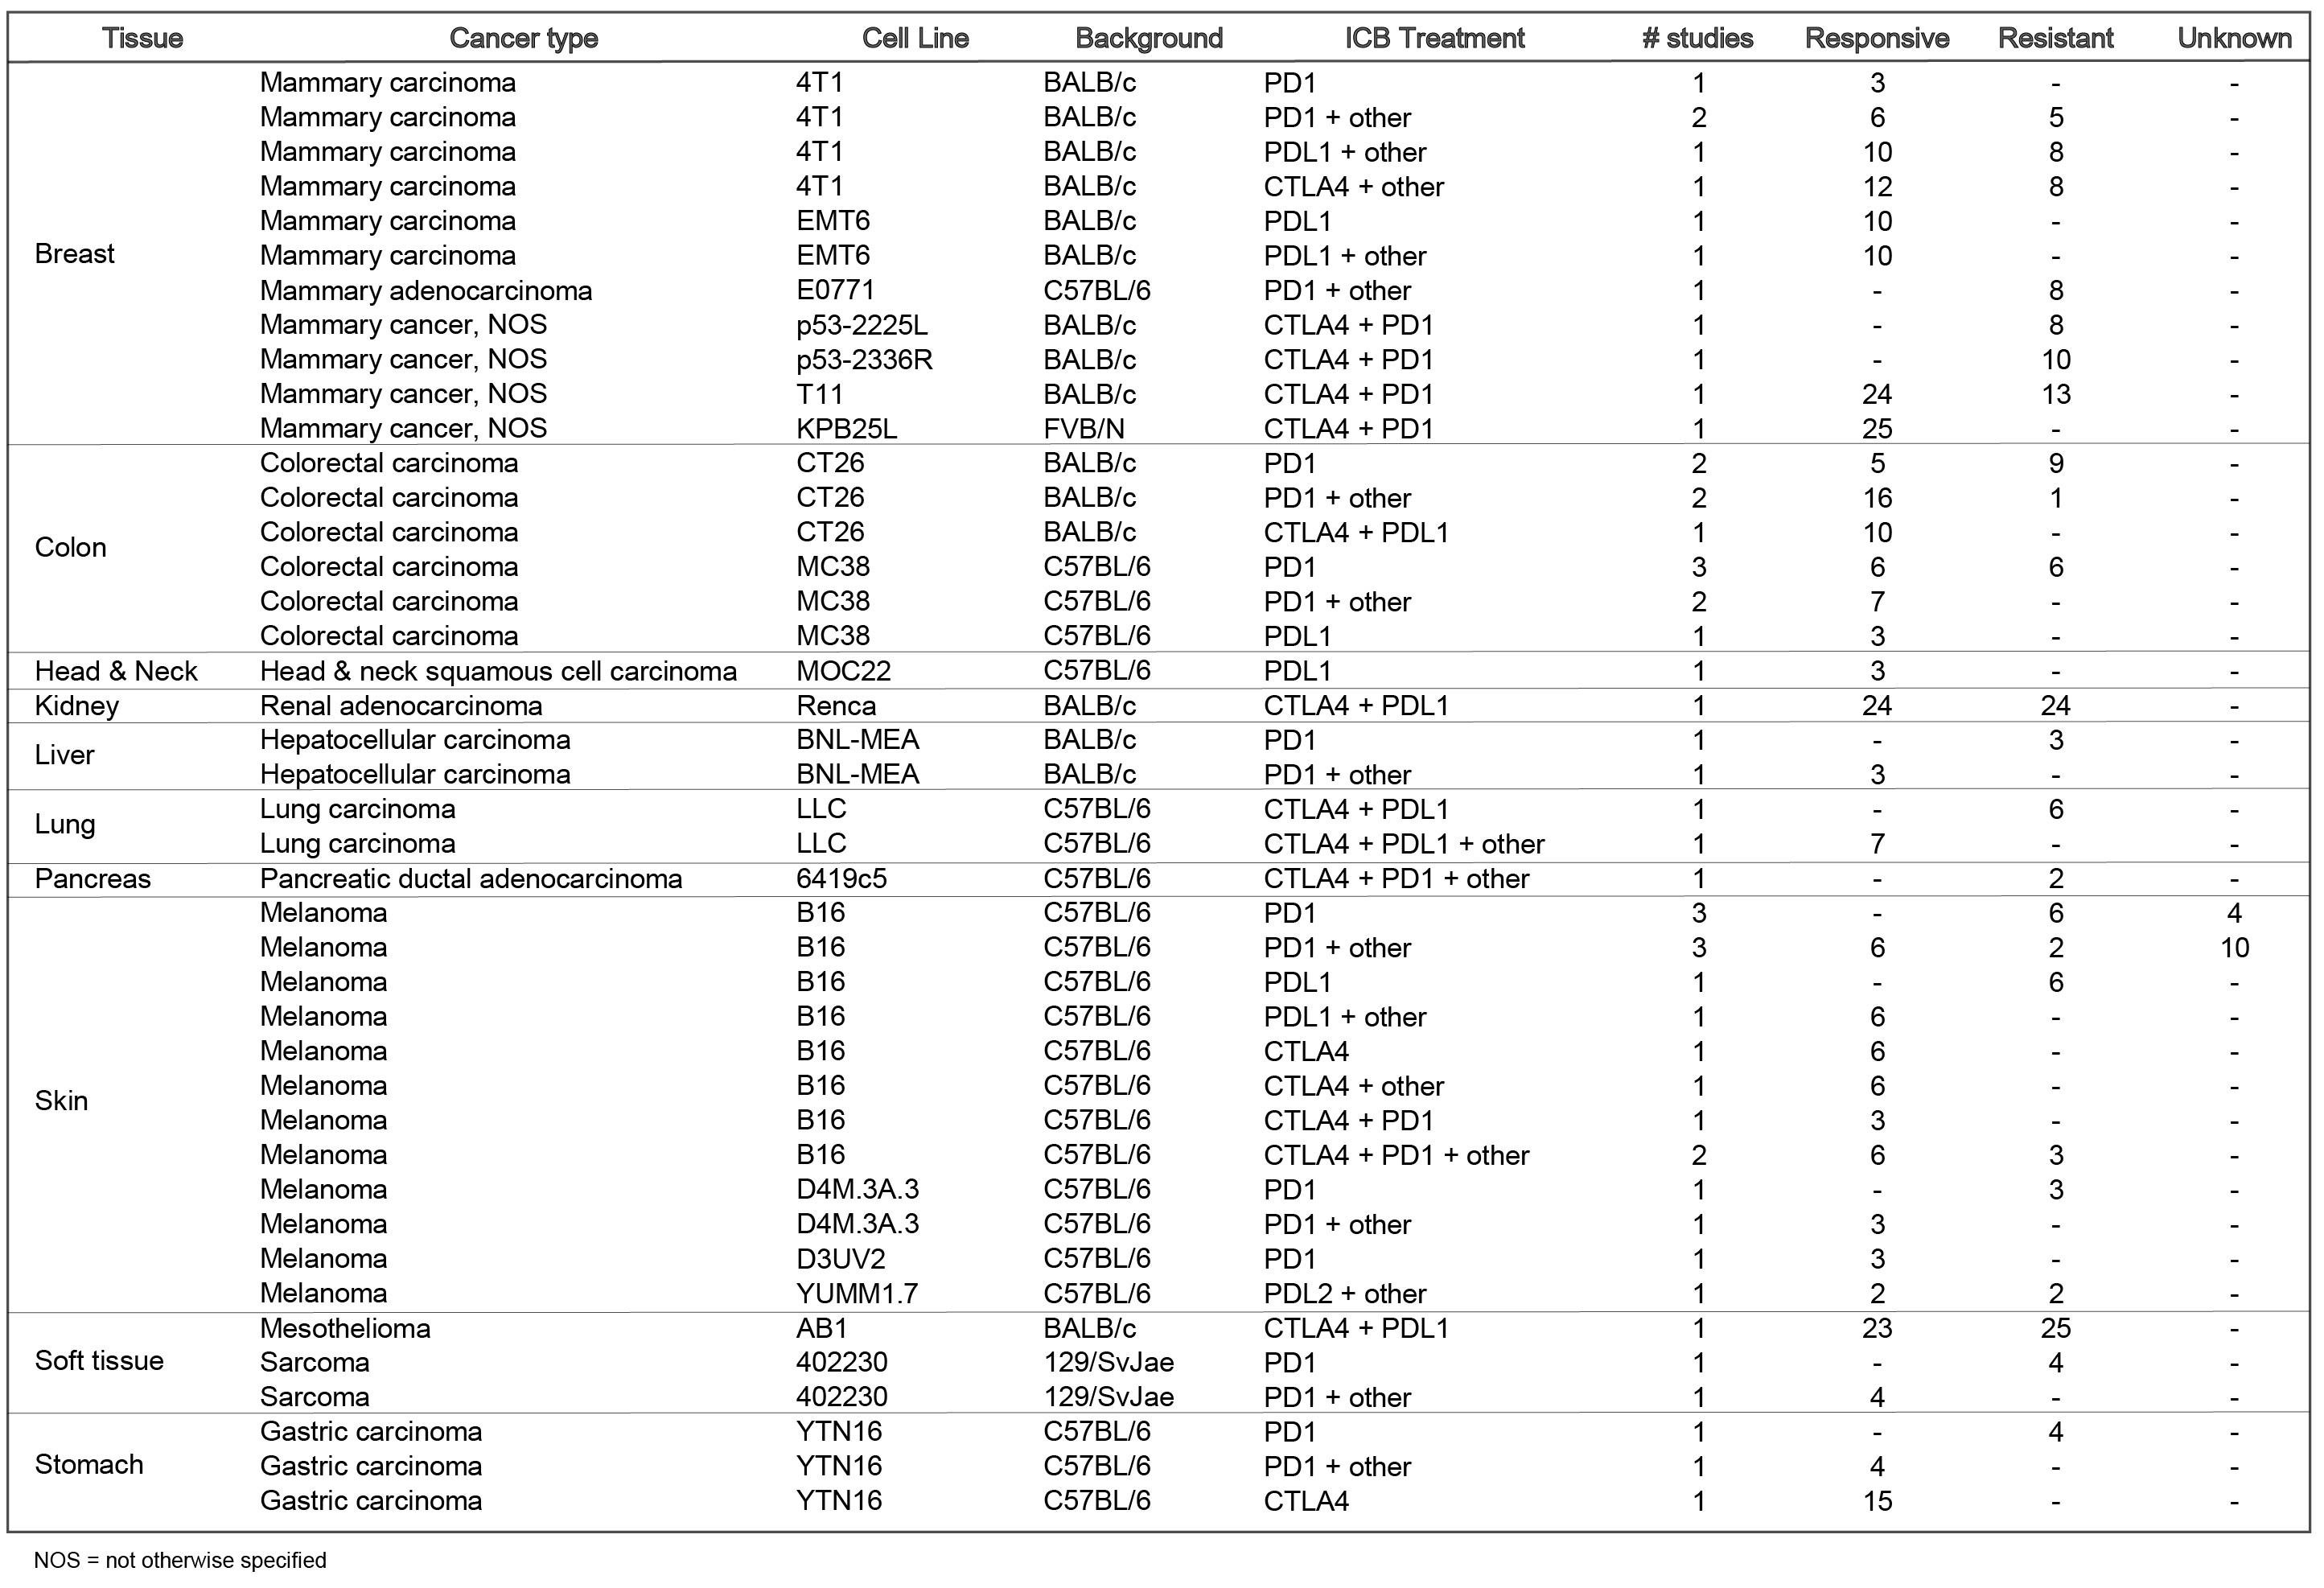
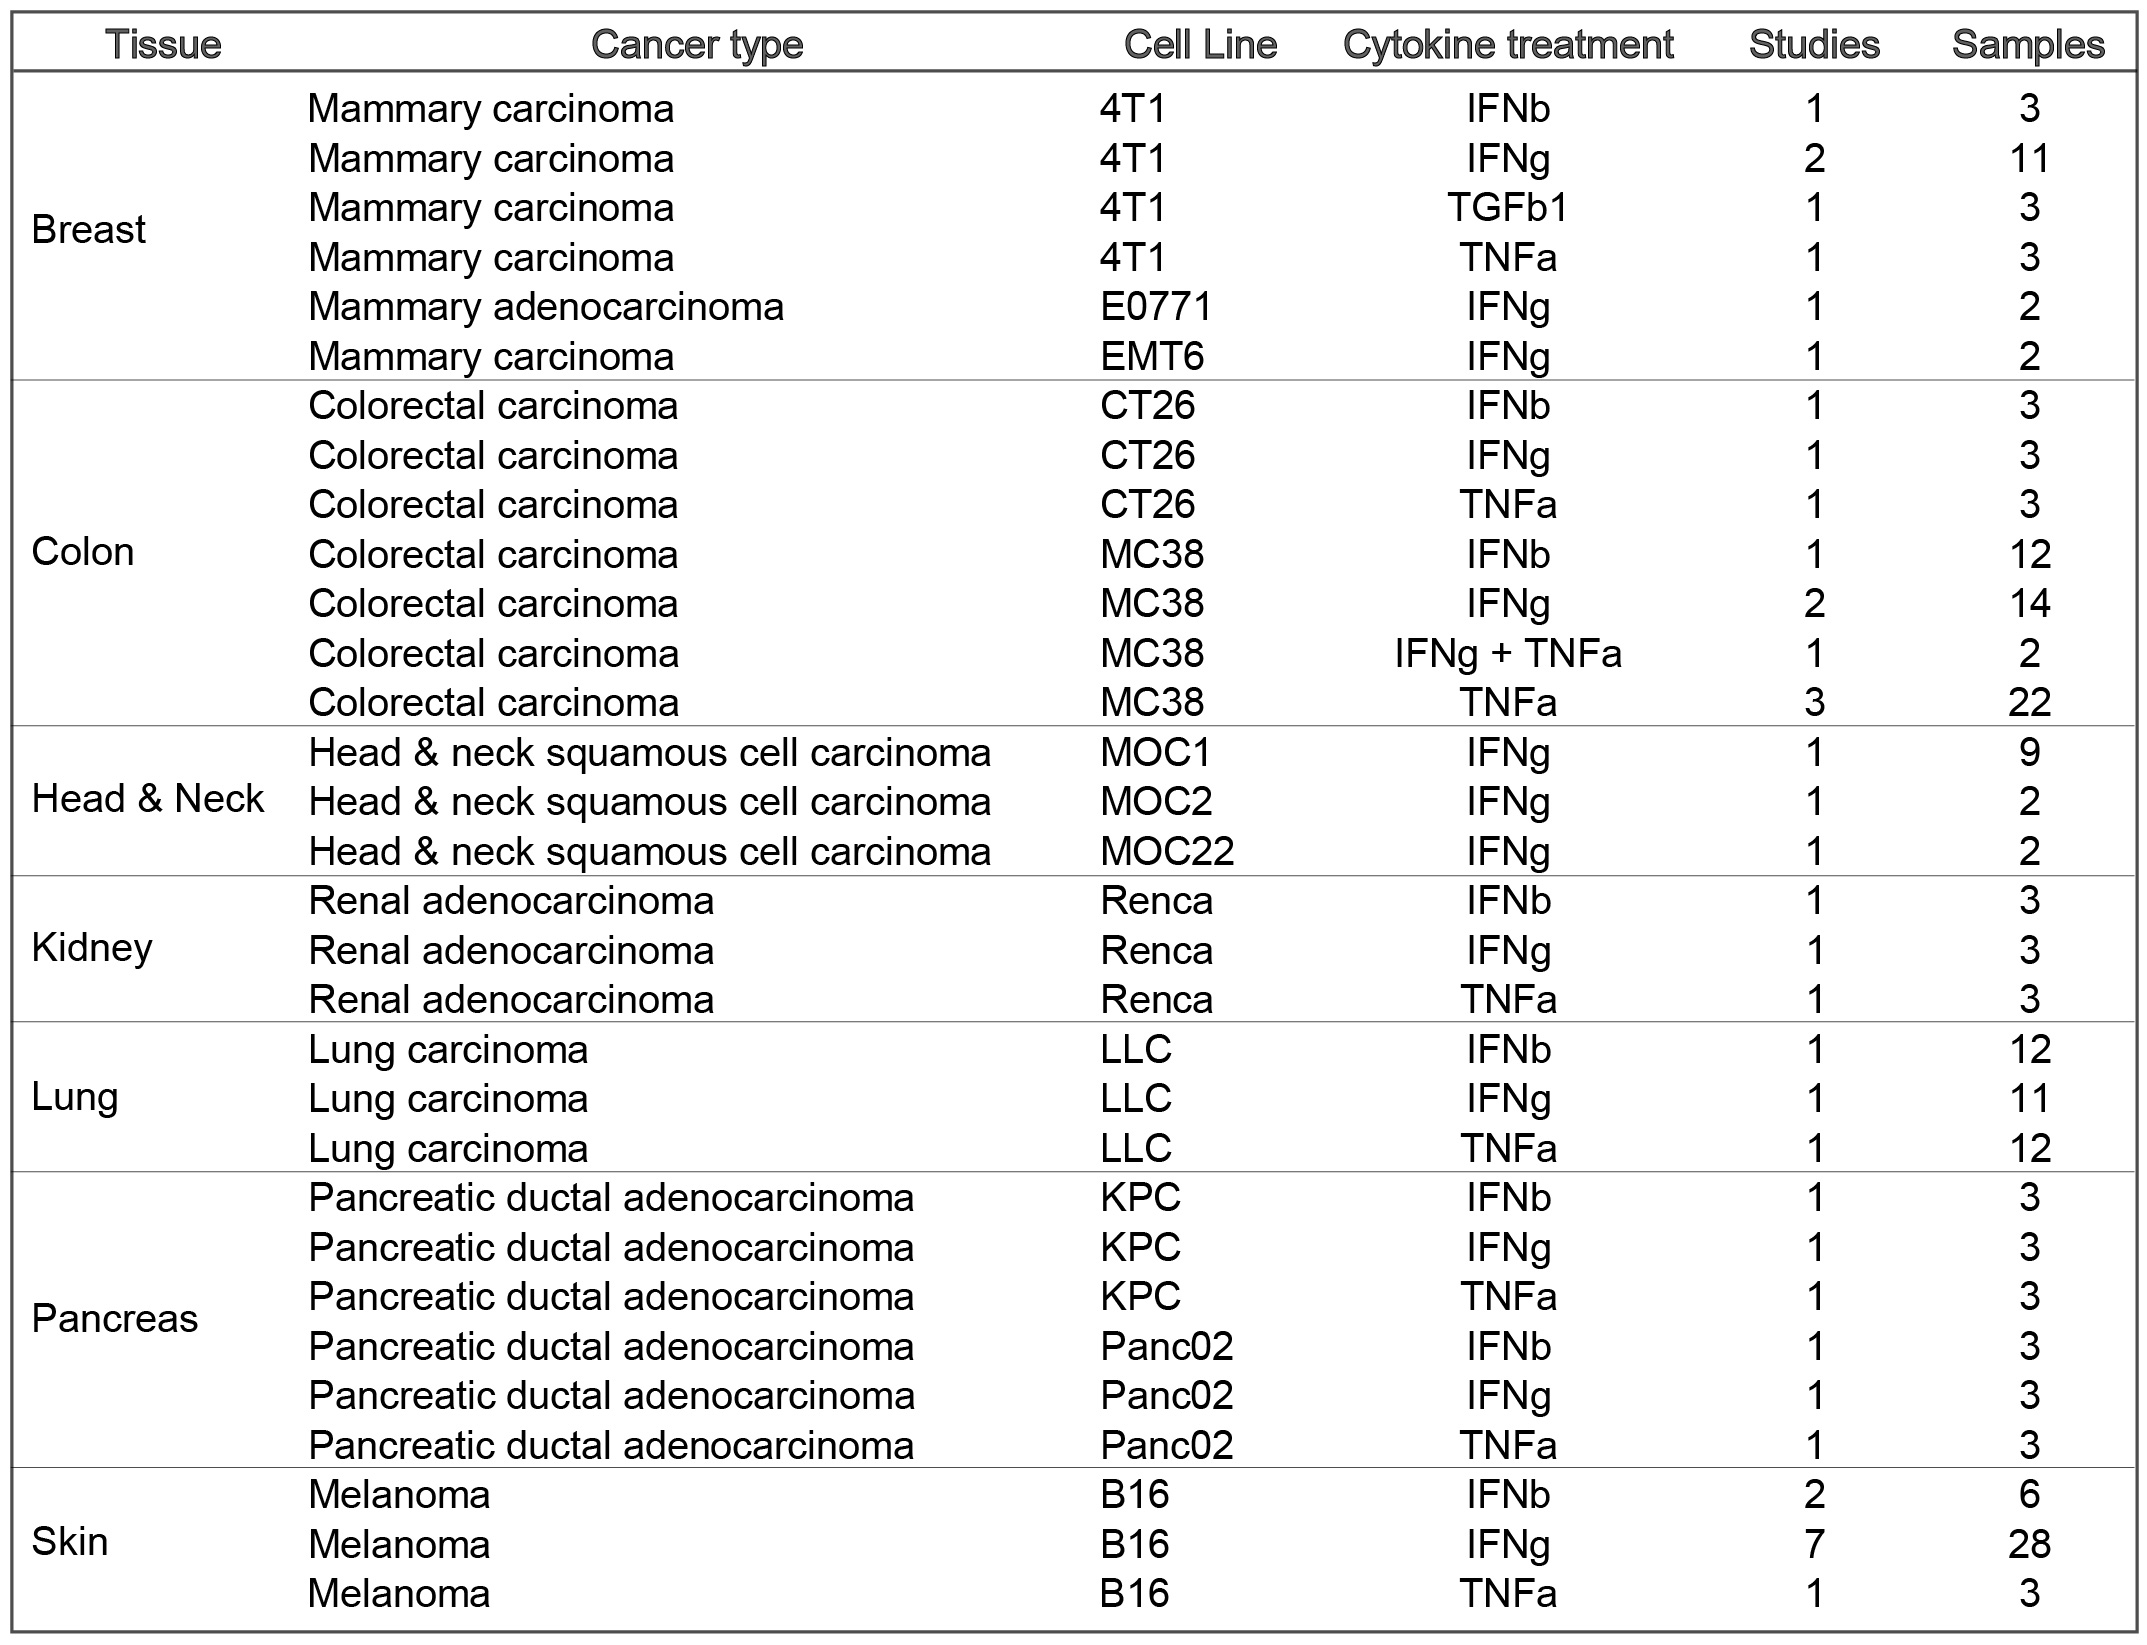
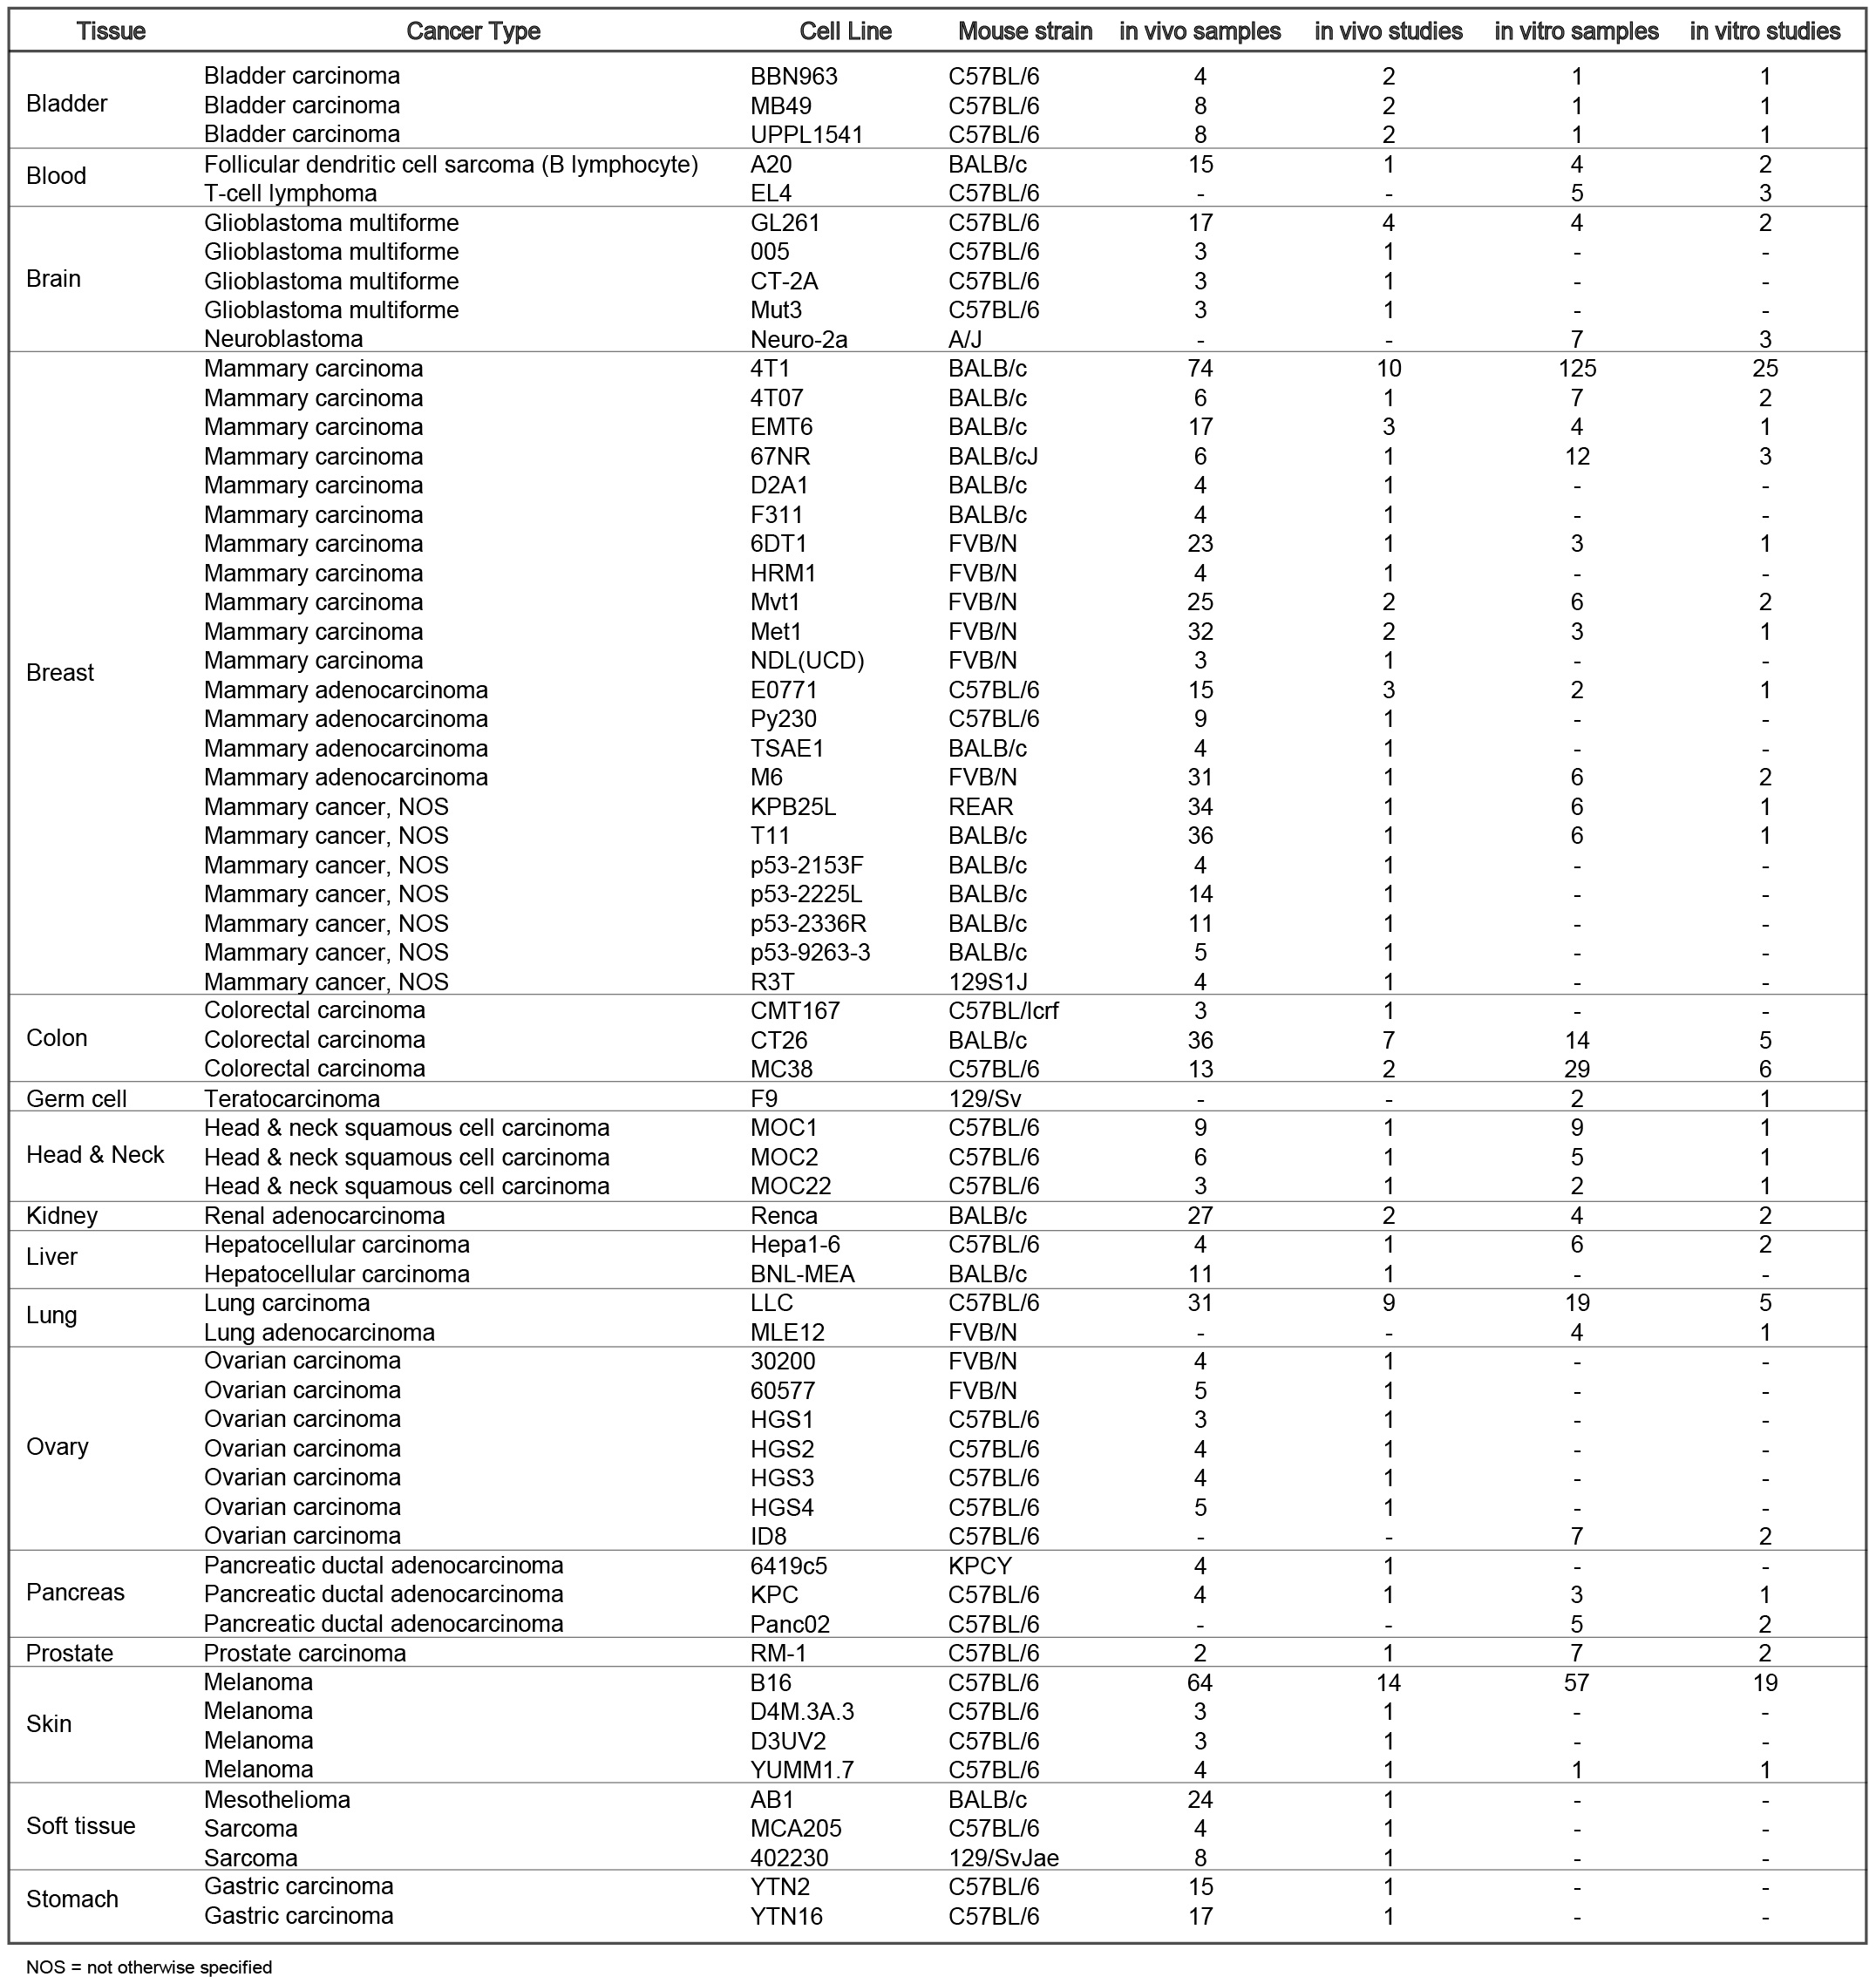
An overview of the syngeneic mouse model data in the TISMO database. TISMO contains 605 in vitro RNA-seq samples from 49 syngeneic cancer cell lines across 23 cancer types, of which 195 underwent cytokine treatment. TISMO also includes 1,518 in vivo RNA-seq samples from 68 syngeneic mouse tumor models across 19 cancer types, of which 832 were from immune checkpoint blockade (ICB) studies. The ‘ICB Treatment’ tab summarizes tumor samples treated with immune-checkpoint blockade such as anti-PD1, anti-PDL1, anti-PDL2, antiCTLA4, and anti-CTLA4 + anti-PD1/L1 combinations. The ‘Cytokine Treatment’ tab summarizes in vitro tumor lines treated with cytokines such as interferon γ (IFNγ), IFNβ, tumor necrosis factor alpha (TNFα) and transforming growth factor (TNFβ). The ‘Baseline’ tab summarizes in vivo and in vitro samples used as study controls (e.g. untreated, isotype or vehicle treated).
We have collected available survival information from published studies. Survival information is available in 32% of ICB-related samples and 24% of total in vivo tumor samples in TISMO.
Compare gene expression levels across different tumor models and ICB treatments, between pre- and post-ICB treatment and responders and non-responders.
ICB treatments included in this module: anti-PD1, anti-PDL1, anti-PDL2, and anti-CTLA4.
The differences between groups are statistically evaluated by Wald test using DESeq2 (*FDR ≤ 0.05, **FDR ≤ 0.01, ***FDR ≤ 0.001), and the comparison results are summarized in boxplots.
Tumor models included are: Mammary cancer: 4T1, E0771, EMT6, T11, KPB25L, p53-2225L, p53-2336R; Colorectal carcinoma: CT26, MC38; Gastric adenocarcinoma: YTN16; Head and neck squamous cell carcinoma: MOC22; Hepatocellular carcinoma: BNL-MEA; Lung carcinoma: LLC; Melanoma: B16, YUMM1.7, D3UV2, D4M.3A.3; Sarcoma: 402230.
Compare gene expression levels across cell-lines between pre- and post-cytokine treated samples.
Cytokine treatments included in this module: IFNγ, IFNβ, TNFα, and TGFb1.
The differences between groups are statistically evaluated by Wald test using DESeq2 (*FDR ≤ 0.05, **FDR ≤ 0.01, ***FDR ≤ 0.001), and the comparison results are summarized in boxplots.
Cell lines included are: Mammary cancer: 4T1, EMT6, E0771; Colorectal carcinoma: CT26, MC38; Lung carcinoma: LLC; Head and neck squamous cell carcinoma: MOC1; Melanoma: B16; Pancreatic ductal adenocarcinoma: KPC, Panc02; Renal adenocarcinoma: Renca;
Compare pathways across different tumor models and ICB-treatments, between pre- and post-ICB treatment and responders and non-responders.
ICB treatments included in this module: anti-PD1, anti-PDL1, anti-PDL2, and anti-CTLA4.
The differences between groups are statistically evaluated by the Wilcox test (*p-value ≤ 0.05, **p-value ≤ 0.01, ***p-value ≤ 0.001), and the comparison results are summarized in boxplots.
Tumor models included are: Mammary cancer: 4T1, E0771, EMT6, T11, KPB25L, p53-2225L, p53-2336R; Colorectal carcinoma: CT26, MC38; Gastric adenocarcinoma: YTN16; Head and neck squamous cell carcinoma: MOC22; Hepatocellular carcinoma: BNL-MEA; Lung carcinoma: LLC; Melanoma: B16, YUMM1.7, D3UV2, D4M.3A.3; Sarcoma: 402230.
Compare pathways across cell-lines, between pre- and post-cytokine treatment.
Cytokine treatments included in this module: IFNγ, IFNβ, TNFα, and TGFb1.
The differences between groups are statistically evaluated by the Student's t-test (*p-value ≤ 0.05, **p-value ≤ 0.01, ***p-value ≤ 0.001), and the comparison results are summarized in boxplots.
Cell lines included are: Mammary cancer: 4T1, EMT6, E0771; Colorectal carcinoma: CT26, MC38; Lung carcinoma: LLC; Head and neck squamous cell carcinoma: MOC1; Melanoma: B16; Pancreatic ductal adenocarcinoma: KPC, Panc02; Renal adenocarcinoma: Renca;
Upload a list of genes as a biomarker (weighted or unweighted; please download the sample file as a reference). This function will use the average/weighted expression of the custom geneset as a new biomarker and compare the new biomarker across tumor models and ICB-treatments, between pre- and post-ICB treatments and responders and non-responders.
ICB treatments included in this module: anti-PD1, anti-PDL1, anti-PDL2, and anti-CTLA4.
The differences between groups are statistically evaluated by the Wilcox test (*p-value ≤ 0.05, **p-value ≤ 0.01, ***p-value ≤ 0.001), and the comparison results are summarized in boxplots.
Tumor models included are: Mammary cancer: 4T1, E0771, EMT6, T11, KPB25L, p53-2225L, p53-2336R; Colorectal carcinoma: CT26, MC38; Gastric adenocarcinoma: YTN16; Head and neck squamous cell carcinoma: MOC22; Hepatocellular carcinoma: BNL-MEA; Lung carcinoma: LLC; Melanoma: B16, YUMM1.7, D3UV2, D4M.3A.3; Sarcoma: 402230.
Upload a list of genes as biomarker (weighted or unweighted; please download the sample file as reference). This function will use the average/weighted expression of the custom geneset as a new biomarker and compare the new biomarker between pre- and post-cytokine treatments or between cell lines.
Cytokine treatments included in this module: IFNγ, IFNβ, TNFα, and TGFb1.
The differences between groups are statistically evaluated by the Student's t-test (*p-value ≤ 0.05, **p-value ≤ 0.01, ***p-value ≤ 0.001), and the comparison results are summarized in boxplots.
Cell lines included are: Mammary cancer: 4T1, EMT6, E0771; Colorectal carcinoma: CT26, MC38; Lung carcinoma: LLC; Head and neck squamous cell carcinoma: MOC1; Melanoma: B16; Pancreatic ductal adenocarcinoma: KPC, Pan02; Renal adenocarcinoma: Renca;
Compare immune cell infiltration levels across different tumor models and ICB-treatments, between pre- and post-ICB treatment and responders and non-responders.
ICB treatments included in this module: anti-PD1, anti-PDL1, anti-PDL2, and anti-CTLA4.
The immune cell infiltrations were inferred by: TIMER, xCell, CIBERSORT, EPIC, quanTIseq, and mMCPcounter.
The differences between groups are statistically evaluated by the Wilcox test (*p-value ≤ 0.05, **p-value ≤ 0.01, ***p-value ≤ 0.001), and the comparison results are summarized in boxplots.
Tumor models included are: Mammary cancer: 4T1, E0771, EMT6, T11, KPB25L, p53-2225L, p53-2336R; Colorectal carcinoma: CT26, MC38; Gastric adenocarcinoma: YTN16; Head and neck squamous cell carcinoma: MOC22; Hepatocellular carcinoma: BNL-MEA; Lung carcinoma: LLC; Melanoma: B16, YUMM1.7, D3UV2, D4M.3A.3; Sarcoma: 402230.
Compare immune cell infiltration levels between treatment-naive syngeneic mouse models.
The immune cell infiltrations were inferred by: TIMER, xCell, CIBERSORT, EPIC, quanTIseq, and mMCPcounter.
Tumor models included are: Bladder Carcinoma: BBN963, UPPL1541; Mammary cancer: 4T07, 4T1, 67NR, 6DT1, E0771, EMT6, M6, Met1, Mvt1, Py230; Colorectal carcinoma: MC38, CT26; Follicular dendritic cell sarcoma: A20; Glioblastoma multiforme: GL261; Head and neck squamous cell carcinoma: MOC1, MOC2; Hepatocellular carcinoma: Hepa1-6; Lung carcinoma: LLC; Melanoma: B16, YUMM1.7; Pancreatic ductal adenocarcinoma: KPC, KCP.
TISMO database, including manually curated metadata (cancer type, cell line, cell treatment, cell genotype, mouse genotype, mouse strain, route of tumor implantation, implantation site, mouse ICB treatment, and response status ), immune cell infiltration levels inferred by six state-of-the-art algorithms, and quantified gene expresisons are available for download.
Cell Lines - meta
Sample In Vitro - meta
Sample In Vivo - meta
in vitro - Expression Matrices
in vivo - Expression Matrices
Immune Cell Infiltrations
Data Collection and Processing for TISMO database
We developed a parser to query datasets deposited in the Gene Expression Omnibus (GEO) (1) between 2016 and 2021. Using this parser, we performed keyword searches to identify studies matching a list of manually curated syngeneic mouse models or syngeneic cancer cell lines. For matched studies, meta-files containing study design and sample information were downloaded through the parser. We manually curated and confirmed each sample for database inclusion. We also annotated syngeneic mouse model phenotypes through literature searches. In total, we collected 1,868 syngeneic tumor or cell line RNA-seq samples from 137 published studies. We also included 255 in-house RNA-seq samples generated by ourselves which have not been published before.
To ensure consistency, we downloaded raw sequencing reads from each study and processed the data through a standardized pipeline called RNA-seq IMmune Analysis Pipeline (RIMA, https://kateyliu.github.io/RIMA/) (Fig. 1). RIMA is an automated Snakemake pipeline developed by our group to streamline the processing of RNA-seq data, including but not limited to quality control, read alignment, expression qualification, batch effect removal, and immune cell infiltration inference. FASTQ files containing the raw reads were downloaded or transferred. Read alignments were performed with STAR (2) (v.2.4.2a) against the mm10 reference genome assembly (mm10, Genome Reference Consortium Mouse Build 38) from the NCI Genomic Data Commons (GDC). RNA-seq quality control (QC) was performed on the aligned BAM files using RSeQC (3) (v2.4). With the reads appropriately aligned, expression levels were quantified by SALMON (4) (v.0.14.0) on the BAM files. Ensemble IDs were converted to mouse gene symbols (GRCm38.p6).
Fig.1 Standardized pipeline to process raw sequencing data, including quality control, alignment, expression qualification, batch effect removal, and immune cell infiltration inference. Immune cell infiltration were inferred by six state-of-the-art algorithms, including TIMER (14), xCell (15), CIBERSORT (16), EPIC (17), quanTIseq (18), and mMCPcounter (19). For the ICB-treated samples, comparison between the treatment and response groups could be performed for hypothesis testing and biomarker optimization.
We also characterized pathway enrichment for each sample to enable comparison between conditions. Specifically, for each sample, pathway levels were characterized by single sample gene set enrichment analysis (ssGSEA) (5), a method that measures the pathway level in an individual expression profile. From Molecular Signatures Database (MSigDB) (6), we collected 17,456 gene-sets, including 7,479 GO biological processes, 996 GO cellular components, 1,704 GO molecular functions (7), 186 Kyoto Encyclopedia of Genes and Genomes (KEGG) pathways (8), 4,872 immunologic signatures (6), 615 wiki pathways, and 1,604 Reactome pathways (9).
Samples collected from different studies were processed with different protocols and platforms, and subject to technical bias. We normalized the data for consistency when visualizing cohorts, even though TISMO conducts all sample comparisons within each cohort. Specifically, for each cohort we pre-computed false discovery rates (FDR) using DESeq2 (10) for each gene and comparison condition. To aid visualization, we standardized the transcriptome TPM data across samples by quantile normalization to calibrate the scaling and distribution differences between datasets. We then performed batch effect correction between studies using ComBat (11). Notably, the combination of quantile normalization and ComBat achieved the best performance for batch effect removal in a benchmark study (12).
To make reliable and robust immune cell infiltration estimations, we utilized Immunedeconv (13), an R package that integrates state-of-the-art algorithms for immune deconvolution, including TIMER (14), xCell (15), CIBERSORT (16), EPIC (17), quanTIseq (18). We also incorporated a murine-specific immune infiltration deconvolution tool, mMCPcounter (19). Although each algorithm has unique properties and strengths (13), immune infiltration estimations supported by multiple algorithms provide more confident results. The source code to search mouse-related studies, download sequencing data, perform batch effect correction, and infer immune infiltration were deposited at the Github repository (https://github.com/zexian/TISMO_data).
The current TISMO database includes 605 in vitro RNA-seq samples from 49 syngeneic cancer cell lines across 23 cancer types. TISMO also contains 1,518 in vivo RNA-seq samples from 68 syngeneic mouse tumor models across 19 cancer types (Fig. 2). Many samples within the TISMO database have undergone different treatments, including anti-PD1, anti-PDL1, anti-PDL2, anti-CTLA4, interferon γ (IFNγ), IFNβ, tumor necrosis factor alpha (TNFα), or in combination with other treatments. We manually annotated phenotypic data for each sample by referencing the original article, including cancer type, cancer cell line, cell treatment, cell genotype, mouse genotype, mouse strain, implantation type, implantation site, mouse ICB treatment, and response status. Gene expression levels were quantified for all samples, and immune cell infiltration levels for each in vivo sample were inferred based on expression profiles. All curated metadata, expression data, and immune infiltration estimation data can be downloaded from the data download from TISMO database.
Fig.2 Summary of TISMO database. TISMO contains 605 in vitro RNA-seq samples from 49 syngeneic cancer cell lines across 23 cancer types, of which 195 underwent cytokine treatment. TISMO also includes 1,518 in vivo RNA-seq samples from 68 syngeneic mouse tumor models across 19 cancer types, of which 832 were from immune checkpoint blockade (ICB) studies. Samples treated with cytokines (IFNγ, IFNβ, TNFα) are labeled in pink; samples treated with ICB (antiPD1, antiPDL1, antiPDL2, antiCTLA4) are labeled in green.
We have collected available survival information from published studies (Fig. 3). Survival information is available in 32% of ICB-related samples and 24% of total in vivo tumor samples in TISMO.
Fig.3 Tumor volume and mouse survival data collected for the ICB related studies by referencing the original articles.
- Barrett T, Wilhite SE, Ledoux P, Evangelista C, Kim IF, Tomashevsky M, Marshall KA, Phillippy KH, Sherman PM, Holko M: NCBI GEO: archive for functional genomics data sets—update. Nucleic acids research 2012, 41:D991-D995.
- Dobin, A., Davis, C.A., Schlesinger, F., Drenkow, J., Zaleski, C., Jha, S., Batut, P., Chaisson, M. and Gingeras, T.R. (2013) STAR: ultrafast universal RNA-seq aligner. Bioinformatics, 29, 15-21.
- Wang, L., Wang, S. and Li, W. (2012) RSeQC: quality control of RNA-seq experiments. Bioinformatics, 28, 2184-2185.
- Patro, R., Duggal, G., Love, M.I., Irizarry, R.A. and Kingsford, C. (2017) Salmon provides fast and bias-aware quantification of transcript expression. Nature methods, 14, 417.
- Barbie, D.A., Tamayo, P., Boehm, J.S., Kim, S.Y., Moody, S.E., Dunn, I.F., Schinzel, A.C., Sandy, P., Meylan, E. and Scholl, C. (2009) Systematic RNA interference reveals that oncogenic KRAS-driven cancers require TBK1. Nature, 462, 108-112.
- Subramanian, A., Tamayo, P., Mootha, V.K., Mukherjee, S., Ebert, B.L., Gillette, M.A., Paulovich, A., Pomeroy, S.L., Golub, T.R. and Lander, E.S. (2005) Gene set enrichment analysis: a knowledge-based approach for interpreting genome-wide expression profiles. Proceedings of the National Academy of Sciences, 102, 15545-15550.
- (2021) The Gene Ontology resource: enriching a GOld mine. Nucleic acids research, 49, D325-D334
- Kanehisa, M., Furumichi, M., Sato, Y., Ishiguro-Watanabe, M. and Tanabe, M. (2021) KEGG: integrating viruses and cellular organisms. Nucleic acids research, 49, D545-D551.
- Jassal, B., Matthews, L., Viteri, G., Gong, C., Lorente, P., Fabregat, A., Sidiropoulos, K., Cook, J., Gillespie, M. and Haw, R. (2020) The reactome pathway knowledgebase. Nucleic acids research, 48, D498-D503.
- Love, M.I., Huber, W. and Anders, S. (2014) Moderated estimation of fold change and dispersion for RNA-seq data with DESeq2. Genome biology, 15, 550.
- Johnson, W.E., Li, C. and Rabinovic, A. (2007) Adjusting batch effects in microarray expression data using empirical Bayes methods. Biostatistics (Oxford, England), 8, 118-127
- Müller, C., Schillert, A., Röthemeier, C., Trégouët, D.-A., Proust, C., Binder, H., Pfeiffer, N., Beutel, M., Lackner, K.J. and Schnabel, R.B. (2016) Removing batch effects from longitudinal gene expression-quantile normalization plus ComBat as best approach for microarray transcriptome data. PloS one, 11, e0156594.
- Sturm, G., Finotello, F. and List, M. (2020) Immunedeconv: An R Package for Unified Access to Computational Methods for Estimating Immune Cell Fractions from Bulk RNA-Sequencing Data. Methods in molecular biology (Clifton, N.J.), 2120, 223-232
- Li, T., Fu, J., Zeng, Z., Cohen, D., Li, J., Chen, Q., Li, B. and Liu, X.S. (2020) TIMER2. 0 for analysis of tumor-infiltrating immune cells. Nucleic acids research, 48, W509-W514.
- Aran, D., Hu, Z. and Butte, A.J. (2017) xCell: digitally portraying the tissue cellular heterogeneity landscape. Genome Biol, 18, 220.
- Newman, A.M., Liu, C.L., Green, M.R., Gentles, A.J., Feng, W., Xu, Y., Hoang, C.D., Diehn, M. and Alizadeh, A.A. (2015) Robust enumeration of cell subsets from tissue expression profiles. Nature methods, 12, 453-457.
- Racle, J., de Jonge, K., Baumgaertner, P., Speiser, D.E. and Gfeller, D. (2017) Simultaneous enumeration of cancer and immune cell types from bulk tumor gene expression data. Elife, 6
- Finotello, F., Mayer, C., Plattner, C., Laschober, G., Rieder, D., Hackl, H., Krogsdam, A., Loncova, Z., Posch, W., Wilflingseder, D. et al. (2019) Molecular and pharmacological modulators of the tumor immune contexture revealed by deconvolution of RNA-seq data. Genome Med, 11, 34.
- Petitprez, F., Levy, S., Sun, C.M., Meylan, M., Linhard, C., Becht, E., Elarouci, N., Tavel, D., Roumenina, L.T., Ayadi, M. et al. (2020) The murine Microenvironment Cell Population counter method to estimate abundance of tissue-infiltrating immune and stromal cell populations in murine samples using gene expression. Genome medicine, 12, 86